I have been responsible for automating a large portion of the software build environment for Cpac Systems marine products. Basically new software is built by an automated build server every time someone commits new code to the software repository, but also on request when a software release needs to be done. I have automated the build and release processes piece by piece and now (with a few exceptions) we can release a new software for a large batch of products in a matter of minutes, compared to before when a software release could take a day. The reason for this is Python scripts that handle the complete build and documentation process of every software, which is done in parallell for a multitude of products. Before this process would be done by individuall software programmers for "their product" on build day.


Cpac Systems: Automatic Hardware-in-the-loop (HIL) tests
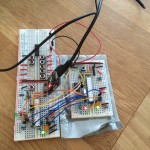
I like automating boring tasks, and one of them sometimes is integration testing. At Cpac Systems I have been writing scripts and configuring hardware for automatic testing of Electronic Control Units (ECUs). Basically connecting the essential control units for running a boat to the same system, and writing automatic test cases that perform hardware-in-the-loop (HIL) tests. All of it connected to Jenkins Continous Integration server.
![]()
ODE solver in Python using custom Forward-Euler

For realtime simulation it is important to have an ODE solver that is simple enough. I did not find any plug-and-play kind of ODE solvers for realtime applications so I wrote one myself. The greatest benefit of this approach is that you have full control of every time step. Good for realtime simulations.
https://github.com/sebnil/Python-ODE-Forward-Euler/blob/master/Forward-Euler%20ODE%20solver.ipynb
It is very simple but show the basics of how to write an ODE solver. It could be extended to use more sophisticated solvers like Runge-Kutta or Crank-Nicolson.
Trying some game development in Python

I wanted to learn some basic game development in OpenGL and Python. Pyglet is very good for this kind of thing. Unfortunately it seems to have a less active community compared to Pygame (but in my opinion Pyglet seems much more Pythonic in its design). My game will not win any awards since it is a Asteroids clone. But it has some other features like:
- Bullets have recoil and will slightly accelerate the ship rearwards when shooting.
- Game graphics from a professional artist. (nalishac.com)
- When I started this list I thought there would be more features but I think this is it.
Using a lot of code and inspiration from:
Code structure and inspiration from:
Infrared experiments to control the television from a website
Where is the remote? Wouldn't it be good if you could switch channels on the television from a website. A wanted to see if it is possible. It didn't.. Note to self; buy more powerful IR transmitters.

Calculate Personal Financial worth with Python
I wanted to know how much my financial assets are worth across one or more bank accounts, so I created a small python script for it.
I just type all my assets into a list like this:
assets = {
    'AAPL': {
        'own': 40,
        'current_value': yahoo_share('AAPL')
    },
    'Coca-Cola': {
        'own': 35,
        'current_value': yahoo_share('KO')
    },
    'NOF': {
        'own': 170,
        'current_value': yahoo_share('NOF.OL')
    },
    'Nordnet Superfonden Sverige': {
        'own': 6.4099,
        'current_value': morningstar("http://www.morningstar.se/Funds/Quicktake/Overview.aspx?perfid=0P0000J24W")
    },
    'SEB Japanfond': {
        'own': 491.8263,
        'current_value': morningstar("http://www.morningstar.se/Funds/Quicktake/Overview.aspx?perfid=0P00000LU7")
    },
}
Then I run the script and get an output looking a bit like this:

(Not my actual positions 🙂 )
Next step is to program a get rich quick algorithm. Until then the code for calculating assets is published here:
https://github.com/sebnil/Pengar
Responsive one-page WordPress site
I have not been doing wordpress sites for a while but today I changed that. Nalisha Chouraria needed a simple personal webpage and I got it done in a day by using some shortcuts (mainly Twitter bootstrap css).

HIL testing in Arduino
I am trying out Hardware-in-the loop simulation on a new Arduino project for a client. Test driven development is unfortunately not very big in the Arduino community (yet) so I decided to implement something by myself. The setup is simple:
- One Arduino is running the application software.
- Another Arduino connects to inputs and outputs on the first Arduino. This Arduino will include all the test code.
A test case could for example be, when the user presses a button a LED should light up. The second Arduino will output a signal to the button input on the first Arduino, and then check if the LED pin output is high. Example code is shown below.
void loop() {
  // Simulate that user presses button
  digitalWrite(BUTTON_PIN, 1);

  // check that the LED lights up
 assert(LED_PIN, 1);

 delay(500)

  // check that some actuator starts running
  assert(ACTUATOR_PIN, 1);

  // Simulate that user releases button
 digitalWrite(BUTTON_PIN, 0);

  // Led and actuator should turn off
 assert(LED_PIN, 1);
 assert(ACTUATOR_PIN, 1);

  // stop execution
 while (1) {}
}

bool assert(uint8_t pin, bool expectedState) {
 bool state = digitalRead(pin);
  if (state != expectedState) {
   Serial.print("## FAILURE: pin ");
   Serial.print(pin);
    Serial.print(" == ");
   Serial.print(state);
    Serial.print(" != ");
   Serial.print(expectedState);
    Serial.println();
   return false;
 }
 else {
    Serial.print("## OK: pin ");
    Serial.print(pin);
    Serial.print(" == ");
   Serial.print(state);
    Serial.println();
   return true;
  }

}
Why the hassle?
It might seem unnecessary, (and it is for simple problems), but it does increase code quality and decreases the risk of bugs being introduced when writing new features to the code.
Making it better
I would like to write my test code in Python on a laptop and control an Arduino (via Firmata for example). Then I would have proper tools for testing and generating test reports. For now the Arduino solution is sufficient though.
Python for sftp and mysql backup
I needed to backup some sftp sites and mysql from a remote server to my local server at home. Piece of cake in Python.
After that I add it as a Jenkins script to schedule periodic backups:


import shutil
import os
import paramiko
import pysftp
import select

import logging

logging.basicConfig(level=logging.DEBUG)


def sftp_backup(ssh_host=None, ssh_username=None, ssh_password=None, source_directory=None, local_directory=None):
    with pysftp.Connection(ssh_host, username=ssh_username, password=ssh_password, log=True) as sftp:
        sftp.chdir(source_directory)

        # first remove the local directory to make room
        try:
            logging.info('Removing local directory: {}'.format(local_directory))
            shutil.rmtree(local_directory)
            logging.info('Done removing local directory: {}'.format(local_directory))
        except:
            logging.info('Can\'t delete {}. Probably does not exist'.format(local_directory))

        # then create the directory
        if not os.path.exists(local_directory):
            logging.info('Creating empty local directory: {}'.format(local_directory))
            os.makedirs(local_directory)
            logging.info('Done creating local directory: {}'.format(local_directory))

        # recursively copy to local_directory
        logging.info('Starging to download from {} to {}'.format(source_directory, local_directory))

        sftp.get_r('', local_directory)

        logging.info('Done')


def dump_mysql_to_file_via_ssh(ssh_host=None, ssh_user=None, ssh_password=None, mysql_host=None, mysql_user=None,
                               mysql_password=None, mysql_databases=None, output_file='dump.sql'):
    logging.debug('dump_mysql_to_file_via_ssh')

    ssh = paramiko.SSHClient()
    ssh.set_missing_host_key_policy(paramiko.AutoAddPolicy())
    ssh.connect(hostname=ssh_host, username=ssh_user, password=ssh_password)

    stdin, stdout, stderr = ssh.exec_command('mysqldump --host={mysql_host} -u {mysql_user} -p{mysql_password} --databases {mysql_databases}'.format(
        mysql_host=mysql_host,
        mysql_user=mysql_user,
        mysql_password=mysql_password,
        mysql_databases=mysql_databases
    ))

    logging.info('Begin writing to file {}'.format(output_file))
    file = open(output_file, 'wb')

    # Wait for the command to terminate
    while not stdout.channel.exit_status_ready():
        # Only print data if there is data to read in the channel
        if stdout.channel.recv_ready():
            rl, wl, xl = select.select([stdout.channel], [], [], 0.0)
            if len(rl) > 0:
                # Print data from stdout
                r = stdout.channel.recv(1024)
                file.write(str(r))
    file.close()
    logging.info('Done writing to file.')
    ssh.close()

if __name__ == '__main__':
    dump_mysql_to_file_via_ssh(
        ssh_host='ssh.example.com',
        ssh_user='',
        ssh_password='',
        mysql_host='',
        mysql_user='',
        mysql_password='',
        mysql_databases='',
        output_file='sebastiannilsson.com.sql'
        )
    sftp_backup(ssh_host='ssh.example.com', ssh_username='', ssh_password='', source_directory='', local_directory='')
Cpac Systems: Programming for outboard steering and propulsion systems
The project involved solving complex problems and also lots of boat testing around the world (Sweden, Japan and the US). My main tasks were to implement software algorithms, and as a side project I also developed a boat simulator to reduce time spent doing boat testing.
