EnglishSvenska

Algorithmic trading with Python

I have been experimenting with algorithmic trading for a couple of weeks. Zipline is a Python library for backtesting trading algorithms and I would like to share one of the algorithms I made.

import talib
from zipline.api import record, order_target, history, add_history
import dateutil
import logging
from zipline.utils.factory import load_from_yahoo
from zipline.finance.slippage import FixedSlippage
from zipline.algorithm import TradingAlgorithm
from zipline.finance import commission

logging.basicConfig(level=logging.DEBUG)


# initialize algorithm
def initialize(context):
    logging.debug('enter initialize')
    context.set_slippage(FixedSlippage())
    context.set_commission(commission.PerTrade(cost=5))

    context.LOW_RSI = initialize.low_RSI
    context.HIGH_RSI = initialize.high_RSI
    context.rsi_window = initialize.rsi_window
    add_history(context.rsi_window, '1d', 'price')
    context.i = 0
    context.invested = False

# default parameters for algorithm
initialize.rsi_window = 15
initialize.low_RSI = 30
initialize.high_RSI = 70


# Will be called on every trade event for the securities you specify.
def handle_data(context, data):
    logging.debug('enter handle_data')
    context.i += 1
    if context.i < context.rsi_window:
        return

    # get the last RSI value
    prices = history(context.rsi_window, '1d', 'price')
    sec_rsi = talib.RSI(
        prices[context.security].values,
        timeperiod=context.rsi_window - 1)

    # buy and sell flags
    buy = False
    sell = False

    if sec_rsi[-1] < context.LOW_RSI and not context.invested:
        # RSI under 30 indicates oversold, time to buy
        order_target(context.security, 1000)
        logging.debug('Buying {}'.format(context.security))
        context.invested = True
        buy = True

    elif sec_rsi[-1] > context.HIGH_RSI and context.invested:
        # RSI over 70 indicates overbought, sell everything
        order_target(context.security, 0)
        logging.debug('Selling {}'.format(context.security))
        context.invested = False
        sell = True

    # record data for each time increment
    record(secRSI=sec_rsi[-1],
           price=data[context.security].price,
           buy=buy,
           sell=sell)
    logging.info(context.portfolio.cash)


def run_algorithm(
        security='AAPL',
        start_date='20100101',
        end_date='20150101',
        initial_cash=100000,
        rsi_window=15,
        low_RSI=30,
        high_RSI=70):
    logging.debug('run_algorithm begin')
    # dates
    start = dateutil.parser.parse(start_date)
    end = dateutil.parser.parse(end_date)

    # get data from yahoo
    data = load_from_yahoo(stocks=[security], indexes={}, start=start, end=end)
    logging.debug('done loading from yahoo. {} {} {}'.format(
        security, start_date, end_date))

    # create and run algorithm
    algo = TradingAlgorithm(
        initialize=initialize,
        handle_data=handle_data,
        capital_base=initial_cash)
    algo.security = security
    initialize.low_RSI = low_RSI
    initialize.high_RSI = high_RSI
    initialize.rsi_window = rsi_window
    logging.debug('starting to run algo...')
    results = algo.run(data).dropna()
    logging.debug('done running algo')
    return results


if __name__ == '__main__':
    import matplotlib.pyplot as plt

    # run algorithm and get results
    results = run_algorithm(
        security='AAPL',
        start_date='20100101',
        end_date='20150101',
        initial_cash=100000,
        rsi_window=15,
        low_RSI=30,
        high_RSI=70)

    # get s&p500 and nasdaq indexes
    index_data = load_from_yahoo(
        stocks=['^gspc', '^ixic'],
        indexes={},
        start=results.index[0],
        end=results.index[-1])

    # portfolio value, stock holdings and S&P 500 index
    fig = plt.figure(figsize=(12, 6))
    ax11 = fig.add_subplot(311)
    ax12, ax13 = ax11.twinx(), ax11.twinx()
    ax13.spines['right'].set_position(('axes', 1.07))
    ax11.set_ylabel('portfolio value', color='blue')
    ax12.set_ylabel('holdings', color='green')
    ax13.set_ylabel('S&P 500', color='red')

    # portfolio value
    ax11.plot(results.index, results.portfolio_value, color='blue')

    # holdings (number of stocks owned)
    holdings = [0 if t == [] else t[0]['amount'] for t in results.positions]
    ax12.plot(results.index, holdings, color='green')
    ax12.set_ylim([min(holdings) - 30, max(holdings) + 30])

    # index
    ax13.plot(index_data.index, index_data['^gspc'], color='red')

    # algo visualization
    ax21 = fig.add_subplot(312)
    ax21.set_ylabel('stock price', color='blue')
    ax22 = ax21.twinx()
    ax22.set_ylabel('rsi', color='red')

    # stock
    ax21.plot(results.index, results.price, color='blue')

    # add sell and buy flags on top of stock price
    ax21.plot(
        results.ix[results.buy].index,
        results.price[results.buy],
        '^',
        markersize=10,
        color='green')
    ax21.plot(
        results.ix[results.sell].index,
        results.price[results.sell],
        'v',
        markersize=10,
        color='red')

    # rsi value
    ax22.plot(results.index, results.secRSI, color='red')
    # add lines to show under- and over value indicator
    ax22.plot([results.index[0], results.index[-1]], [30, 30], 'k-')
    ax22.plot([results.index[0], results.index[-1]], [70, 70], 'k-')

    # portfolio value, stock value and index in percentage
    ax31 = fig.add_subplot(313)
    ax32, ax33 = ax31.twinx(), ax31.twinx()  # share x for other plots
    ax31.set_ylabel('algo %', color='blue')
    ax32.set_ylabel('snp index %', color='green')
    ax33.set_ylabel('stock %', color='red')
    ax33.spines['right'].set_position(('axes', 1.07))

    # portfolio value
    ax31.plot(
        results.index,
        results.portfolio_value / results.portfolio_value[0] * 100 - 100,
        color='blue')

    # index
    ax32.plot(
        index_data.index,
        index_data['^gspc'] / index_data['^gspc'][0] * 100 - 100,
        color='green')

    # stock value
    ax33.plot(
        results.index,
        results.price /
        results.price[0] * 100 - 100,
        color='red')

    plt.show()

If you get it working you should see a plot similar to this one:
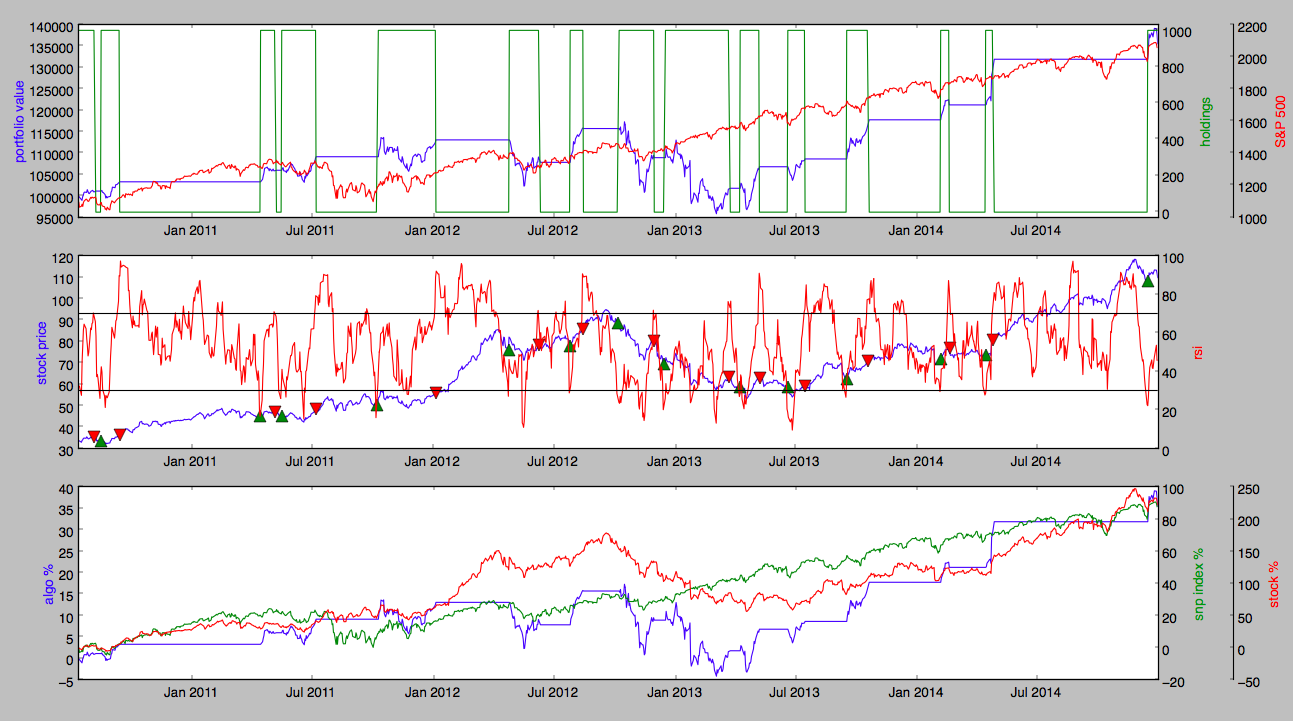
Skärmavbild 2015-04-04 kl. 22.20.20

If you are observant, it is easy to see that the performance of this algorithm is not good enough to be used on a real portfolio, and it is more of a test.

Links:

Tagged with: ,

Wall computer

What to do with a worn out Samsung series 9 ultraslim laptop? Turn it into a wall computer! Perfect for showing weather and traffic information.

Tagged with: , ,

Cpac Systems: Personal involvement in academia connections

Collaboration between industry and academia is something I consider important. From mid 2016 to now I have been the contact person between a vehicle simulation group at Chalmers University of Technology. I also try to attend student fairs where Cpac Systems is exhibiting. All in all, it is a great way of staying in contact with future engineers and technologies.

Master thesis: Remote controlled truck - Proof of concept for designing a remote system for a Volvo truck
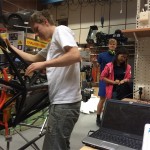
A proof of concept for designing a remote system for a Volvo truck. Designing and buildning a remote control to be able to drive a Volvo truck from outside the truck. Investigating wireless technology, safety aspects, designing and building PCB, designing and building mechanics for remote control, systemizing the whole system and writing embedded code. Simulink was used to glue it all together.

The thesis is available from the Chalmers University online library

Tagged with:

Location, location, location

Läge är kanske den viktigaste parametern när man söker bostad, men varför presenteras den så dåligt på boplats.se? Med Tampermonkey la jag till ett skript som tar bostadsadressen och beräknar avstånd och cykeltid till valfri adress. För mig var det viktigt att min bostad inte var för långt från mitt arbete.

Utan mitt skript ser Boplats.se ut såhär:

boplats.se utan tampermonkey

Och med mitt skript blir Boplats.se en nästan bra webbplats:

bokplats.se med tampermonkey

Hur gör man:

  1. Installera Tampermonkey i Google Chrome
  2. Kodiera mitt skript.
  3. Modifera destinationsadress i koden
  4. Jag tror att skriptet aktiveras automatiskt så fort man går in på Boplats.se. Om inte så trixa i Settings i Tampermonkey.

Tampermonkey-kod:

// ==UserScript==
// @name       Boplats.se enhancer
// @namespace  https://sebastiannilsson.com/blogg/location-location-location/
// @version    0.1
// @description  Adds google maps integration to Boplats.se
// @match      https://boplats.se/
// @copyright  Whatever
// @require http://code.jquery.com/jquery-latest.js
// ==/UserScript==


$(document).ready(function() {
  var i = 0;
    var elements = $('#dgList.tbl_list tr');
    elements.each(function() { 
        if (i++ == 0)
            return;
        var origin = $(this).find('td:eq(1)').text() + ", " + $(this).find('td:eq(2)').text();
        var origin2 = $(this).find('td:eq(1)').text() + ", Göteborg";
        var destination = "Bergskroken 3, Mölndal";

        origin = encodeURIComponent(origin);
        origin2 = encodeURIComponent(origin2);
        destination = encodeURIComponent(destination);
        $.ajax({
            url: "https://sebastiannilsson.com/boplats-google-maps/index.php?origin="+origin+"&destination="+destination+"&mode=bicycling",
            dataType: 'text',
            context: $(this)
        }).done(function(s) {
            console.log("done: https://sebastiannilsson.com/boplats-google-maps/index.php?origin="+origin+"&destination="+destination+"&mode=bicycling");

            if (s== "NOT_FOUND") {
                $.ajax({
                    url: "https://sebastiannilsson.com/boplats-google-maps/index.php?origin="+origin2+"&destination="+destination+"&mode=bicycling",
                    dataType: 'text',
                    context: $(this)
                }).done(function(s2) {
                    console.log("done2: https://sebastiannilsson.com/boplats-google-maps/index.php?origin="+origin2+"&destination="+destination+"&mode=bicycling");
                    $(this).append( "<td>"+s2+"</td>" );
                });  
            }
            else {
                $(this).append( "<td>"+s+"</td>" );
            }
        });
    });
});
Tagged with:

Rapidly building a python gui application

One of my favorite scripting languages is python, and for a couple of good reasons, and the most important reason rapid development from idea to a working application. I will show this with a example by building a simple python app with a gui and then make it ready for deployment by creating an executable file.

Prerequisites:

  • Python 2.7 (and not 3.* since wxpython support is still under development)
  • wxpython will handle the gui stuff.
  • wxformbuilder is a gui editor that can generate wxpython code for us. In most cases this is faster than writing this code by hand.
  • pyinstaller to freeze the application (create an .exe on Windows or a .app on osx)
  • A text editor (sublime, notepad++, pycharm or anything similar)
  • Good enough python skills to know how to install new modules. I will not explain how to install all the modules listed above.

1. Building the gui

Start wxformbuilder. By default a new project is already open. Set filename to gui and code generation to Python:

0 wxformbuilder 6 set project prop

Add a frame:

1 wxformbuilder form1.1 set form name

Add a wxBoxSizer. This will hold our gui components and stack them vertically:

2 wxboxsizer

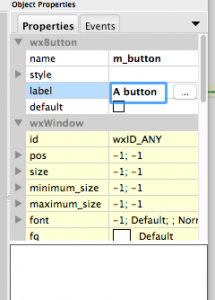
Add a text and a button:

3 wxbitmapbutton

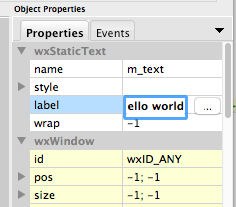
Name them m_text and m_button (or whatever):

5 set prop text4 set prop button

Bind an event for button clicks since we want to do something when the user clicks the button:

4.1 set prop button event

Save the wxformbulder project to a new folder. Then click Generate code from the menu.

7 generate code

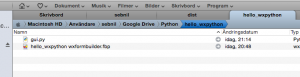
The content of your project folder should contain the wxformbuilder project file and the generated file:

8 files

2. Integrate gui into Python code

The idea is to import the gui file, extend the functions and override the events. Lets use this code as a skeleton:

import wx
import gui

# Extend the gui with some new functionality
class MyFrame(gui.MainFrame):
    def __init__(self, parent, title):
        gui.MainFrame.__init__(self, parent)

    # this is the event we defined in wxformbuilder, and now override from gui.py
    def on_button_click_event(self, event):
        print('on_button_click_event')

# Create wxpython app
class MyApp(wx.App):
    def OnInit(self):
        self.frame = MyFrame(None, "Hello Wxpython")
        self.SetTopWindow(self.frame)
        self.frame.Show(True)
        print("wxApp created.")

        return True

if __name__ == "__main__":
    app = MyApp(redirect=False) # do not redirect stdout to the gui
    app.MainLoop() # render gui continuously

Try running the code and you should see something like this:
9 running the skeleton

Now lets modify it to do something when user clicks the button:

import wx
import gui

# Extend the gui with some new functionality
class MyFrame(gui.MainFrame):
    def __init__(self, parent, title):
        gui.MainFrame.__init__(self, parent)

    # this is the event we defined in wxformbuilder, and now override from gui.py
    def on_button_click_event(self, event):
        print('on_button_click_event')

# Create wxpython app
class MyApp(wx.App):
    def OnInit(self):
        self.frame = MyFrame(None, "Hello Wxpython")
        self.SetTopWindow(self.frame)
        self.frame.Show(True)
        print("wxApp created.")

        return True

if __name__ == "__main__":
    app = MyApp(redirect=False) # do not redirect stdout to the gui
    app.MainLoop() # render gui continuously

Now a button click should trigger the event and print something to the console:

10 running the finnished code

Building an executable (freezing) the application

Since Python is a script language we (usually) don't compile it into machine code. But if you want to deploy your application or send it user which do not have Python installed, you can freeze your application into an executable file (.exe in windows or .app in OS X). There are multiple tools to do this but I choose to use pyInstaller since it works on both windows and OS X, and can pack your application into a single executable instead of multiple files.

In principle, using pyInstaller is quite straight forward. From the terminal (OS X) or command prompt (windows), you can use this command to build your file:
# pyinstaller -y --windowed --onefile --icon=icon/banana.icns --name="' + filename + '" hello_wxpython.py

Build executable from a Python script

I usually use a custom script when I want to build an executable. You can download the pyinstaller_helper module from the github link at the end.

import pyinstaller_helper

pyinstaller_helper.build({
    'script': 'hello_wxpython_tutorial.py',
    'application_name': 'hello wxpython',
    'version': '1.0.0.1',
    'company_name': u'Example',
    'product_name': u'Hello wxPython',
    'internal_name': 'product_name',
    'original_filename': u'Hello wxPython',
    'file_description': 'Lorem ipsum.',
    'legal_copyright': 'your@email.com',
    'legal_trademark': ''
})

Running build_executable.py on OS X will generate an .app file, and on windows a .exe file. The script will create an executable that is specific for that platform, so for me it looks like this:

11 dist code

Download the code

This tutorial is on github.

Build a GUI in python using the Qt framework

If you would like to learn how to build a GUI using the Qt framework instead of Wxpython then try this sponsored link:

https://www.udemy.com/python-gui-programming/

Use the coupon code: sebastiannilsson.com and if you are one of the first 50 you get it for free.

Tagged with: ,

Formula Student Baltic Open 2014

Sensommaren och hösten kunde ha blivit utan praktiskt ingenjörsjobb om det inte vore för att jag blev övertalad att bygga räserbil. Målet var Baltic Open i Estland och dit skulle vi ta CFS13 och CFS13e (alltså både den bensin- och eldrivna bilen).

Tagged with: ,

Gothenburg Startup Hack

Skärmavbild 2014-10-10 kl. 23.11.52

Ett hackaton är ett event för att ta en idé till en enkel prototyp på en begränsad och intensiv tid. Nu börjar konceptet ta allt mer fart i Göteborg (och inte bara i Stockholm som tidigare). Jag bestämde mig för att gå på en av Gothenburg Startup Hacks mingelkvällar för att ta reda på mer, och kan inte säga annat än att jag gillar konceptet. Det är kort och gott ett bra tillfälle att träffa intressanta och kunniga människor, vilket ger plats både åt de som rekryterar till sina företag och de som söker partnerskap av något slag. Får se till att gå på det riktiga eventet när det väl blir av nästa gång.

Självbalanserande ARM (uppdaterad och bättre)

Simplicity is the ultimate sophistication. I den förra versionen av den självbalanserande roboten använde jag totalt 3 mikroprocessorer men har nu designat och programmerat om den på en större ARM mikroprocessor. Med mer kräm i processorn ges en mängd fördelar:

  • Färre komponenter
  • Enklare kretsschema
  • Robust mekanisk design på grund av färre kablar
  • Ingen kommunikation mellan processorer är nödvändig vilket ger en mycket enklare kod
  • Ett litet RTOS sköter trådhanteringen (vilket inte gick på AVR)


Så bygger man en likadan (eller bättre)

Komponenter

Mekanisk design

Läs de äldsta inläggen på projektsidan för att se foton från hur man bygger ihop den. Det enda som behöver tillverkas är de tre plattorna för vilka det finns CAD och ritningar.

Kretsschema

Många har frågat om kretsschema så jag gjorde ett i Altium Designer.

Mjukvara

All kod ligger på Github.

Reglerteknik

Kort använder jag kaskadåterkopplade PID-regulatorer. Den yttre loopen reglerar hastigheten på roboten vilket mäts på tachometrar på motorerna. Den intre loopen reglerar robotens vinkel vilket mäts med en IMU. Den yttre loopen har långsam dynamik och den intre loopen är mycket snabbare. Rent teoretiskt ska det gå att göra en självbalanserande robot med endast den inre loopen men man får väldigt lätt ett beteende av att roboten långsamt rör sig framåt eller bakåt över golvet eftersom återkopplingen från hjulens hastighet saknas.

För att få ytterliggare bättre prestanda används gain scheduling på den inre loopen vilket innebär att regulatorparamterarna ändras beroende på robotens vinkel. En liten vinkel nära jämviksläget innebär konservativa regulatorparametrar där endast små justeringar görs för att hålla roboten stående. Är vinkeln stor är roboten nära att ramla och de aggressiva paramterinställningarna aktiveras med syfte att göra allt för att återfå stabilitet.

Information flow

Information flow

Cascade PID implementation theory

Cascade PID implementation theory

Ändra parametrar

Troligtvis kommer alla parametrar inte fungera utan att de justeras något. I koden finns en struct som kan sättas i setConfiguration(). Smartare är dock är att använda en seriell terminal för att ändra parametrar samtidigt som koden körs. På så sätt behöver man inte programmera om processorn varje gång man vill ändra en parameter. Öppna Serial Monitor i Arduino. Testa att skriva "print configuration" till Arduinon. Om allt fungerar som det ska kommer den svara med att skriva ut alla parametrar. Alla variabler i structen Configuration kan sättas från terminalen. Skriv bara "set" följt av variabelnamn och värde. Exempelvis "set speedPIDKp 1.5". För att aktivera debug skriver du "set debugLevel 2". Om du vill debugga IMU skriver du därefter "set angleRawDebug 1". För att stänga av en debug-variabel skiver du exempelvis "set angleRawDebug 0".

Att hitta rätt regulatorparametrar

Använd en realtidsplotter när du ställer in dina regulatorparametrar så går det enklare.

Tagged with: , , , ,

Cpac Systems: Programming dongles and interfaces for marine networks

When different systems need to exchange data but their protocols differ, then an interface is a solution. For some months I was doing embedded C programming of dongles and interfaces for marine network communication busses (CAN).